Multiple Choice
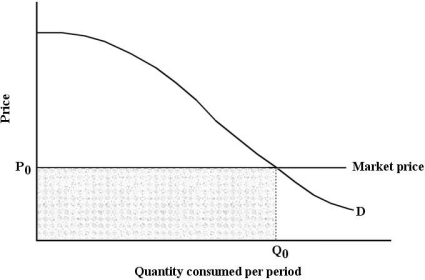 FIGURE 6- 6
-Refer to Figure 6- 6. Suppose that price is P0. The total value placed on all units of the commodity consumed is given by the area
A) below P0 and to the left of Q0.
B) under the demand curve and above P0.
C) under the demand curve and to the right of Q0.
D) under the demand curve.
E) under the demand curve to the left of Q0.
Correct Answer:

Verified
Correct Answer:
Verified
Q26: <img src="https://d2lvgg3v3hfg70.cloudfront.net/TB5438/.jpg" alt=" FIGURE 6- 3
Q27: Suppose a utility- maximizing person consumes only
Q28: Given a particular market demand curve, consumer
Q28: <img src="https://d2lvgg3v3hfg70.cloudfront.net/TB5441/.jpg" alt=" FIGURE 6-2 -Refer
Q29: Given a particular consumer's indifference map, the
Q30: As a consumer moves along an indifference
Q32: Given a typical downward- sloping demand curve
Q33: The diagram below shows a set of
Q34: The figures below show Chris's consumption of
Q35: The figures below show Chris's consumption of