Multiple Choice
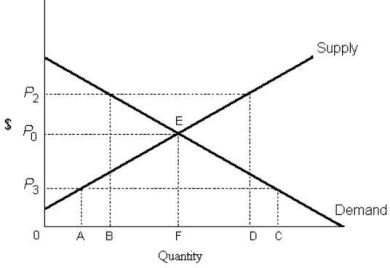 FIGURE 5- 1
-Refer to Figure 5- 1. If the diagram applies to the market for rental housing and P3 represents the maximum rent that can be charged, then
A) units supplied will be reduced relative to the competitive equilibrium by AF rental units.
B) there will be an excess supply of rental units equal to BD.
C) there will be excess demand for rental units equal to FC.
D) there will be excess demand for rental units equal to AF.
E) windfall profits will be earned by landlords.
Correct Answer:

Verified
Correct Answer:
Verified
Q7: In general (and in the absence of
Q8: If the free- market equilibrium price for
Q9: A price ceiling set below the free-
Q10: If a specific market is quite small
Q11: If a binding price ceiling is in
Q13: If a binding price floor is in
Q14: If at some administered price there is
Q15: Consider the market for iron ore, an
Q16: Government price controls<br>A) ensure that transactions take
Q17: <img src="https://d2lvgg3v3hfg70.cloudfront.net/TB5438/.jpg" alt=" FIGURE 5- 3