Multiple Choice
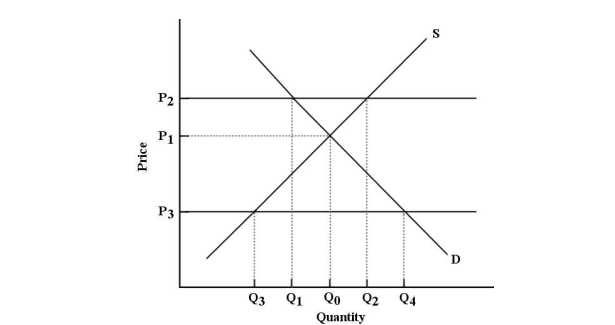 FIGURE 5- 3
-Refer to Figure 5- 3. P3 represents a price imposed by the government. The result would be
A) excess supply of Q3Q0.
B) excess demand of Q1Q2.
C) excess supply of Q3Q4.
D) excess demand of Q0Q2.
E) excess demand of Q3Q4.
Correct Answer:

Verified
Correct Answer:
Verified
Q12: <img src="https://d2lvgg3v3hfg70.cloudfront.net/TB5438/.jpg" alt=" FIGURE 5- 1
Q13: If a binding price floor is in
Q14: If at some administered price there is
Q15: Consider the market for iron ore, an
Q16: Government price controls<br>A) ensure that transactions take
Q18: In free and competitive markets, shortages are
Q19: <img src="https://d2lvgg3v3hfg70.cloudfront.net/TB5438/.jpg" alt=" FIGURE 5- 3
Q20: Deadweight loss represents<br>A) the overall loss of
Q21: Concert promoters often set ticket prices below
Q22: <img src="https://d2lvgg3v3hfg70.cloudfront.net/TB5438/.jpg" alt=" FIGURE 5- 1