Multiple Choice
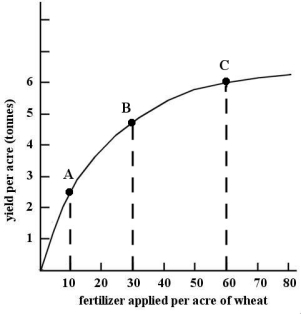 FIGURE 2- 4
-Refer to Figure 2- 4. This non- linear function shows that over the range shown,
A) as the yield per acre increases, the amount of fertilizer required per acre is diminishing.
B) as the yield per acre increases, the amount of fertilizer required per acre is increasing.
C) as more fertilizer is applied, the marginal response in yield is increasing
D) as more fertilizer is applied, the marginal change in yield is diminishing.
E) as more fertilizer is applied, the total yield per acre is diminishing.
Correct Answer:

Verified
Correct Answer:
Verified
Q16: Which of the following statements is NOT
Q19: Suppose an individual wheat farmer's income is
Q30: The table below shows hypothetical per-
Q35: Using the scientific method to approach an
Q37: The table below shows hypothetical per-
Q38: <img src="https://d2lvgg3v3hfg70.cloudfront.net/TB5438/.jpg" alt=" FIGURE 2- 3
Q43: An index number expresses the value of
Q67: A scatter diagram<br>A)plots a series of observations,
Q70: An assertion about the desirability of reducing
Q81: Which of the following is a normative