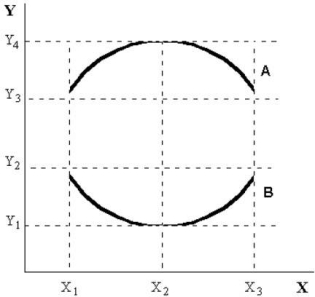
menu-iconExamlexExamLexServices

Discover

Ask a Question
  1. All Topics
  2. Topic
    Business
  3. Study Set
    Microeconomics Study Set 29
  4. Exam
    Exam 2: Economic Theories, Data, and Graphs
  5. Question
    FIGURE 2- 3 -Refer to Figure 2- 3. the Slope of Curve B
Solved

FIGURE 2- 3 -Refer to Figure 2- 3. the Slope of Curve B

Question 38

Question 38

Multiple Choice

  FIGURE 2- 3 -Refer to Figure 2- 3. The slope of curve B is A)  negative from Y1 to Y2 and positive between Y2 and Y3. B)  undefined at X2. C)  always negative but variable. D)  zero at X2. E)  always positive but variable. FIGURE 2- 3
-Refer to Figure 2- 3. The slope of curve B is


A) negative from Y1 to Y2 and positive between Y2 and Y3.
B) undefined at X2.
C) always negative but variable.
D) zero at X2.
E) always positive but variable.

Correct Answer:

verifed

Verified

Unlock this answer now
Get Access to more Verified Answers free of charge

Related Questions

Q16: Which of the following statements is NOT

Q28: Suppose an economist tells you that the

Q30: Suppose point A represents co- ordinates (X=10,

Q34: <img src="https://d2lvgg3v3hfg70.cloudfront.net/TB5438/.jpg" alt=" FIGURE 2- 4

Q35: Using the scientific method to approach an

Q37: The table below shows hypothetical per-

Q41: The table below shows hypothetical per-

Q43: <img src="https://d2lvgg3v3hfg70.cloudfront.net/TB5438/.jpg" alt=" FIGURE 2- 3

Q67: A scatter diagram<br>A)plots a series of observations,

Q81: Which of the following is a normative

Examlex

ExamLex

About UsContact UsPerks CenterHomeschoolingTest Prep

Work With Us

Campus RepresentativeInfluencers

Links

FaqPricingChrome Extension

Download The App

Get App StoreGet Google Play

Policies

Privacy PolicyTerms of ServiceHonor CodeCommunity Guidelines

Scan To Download

qr-code

Copyright © (2025) ExamLex LLC.

Privacy PolicyTerms Of ServiceHonor CodeCommunity Guidelines