Multiple Choice
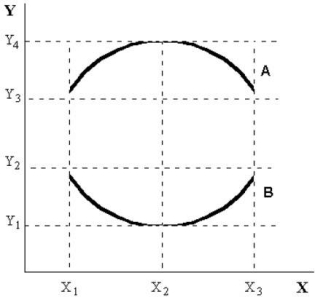 FIGURE 2- 3
-Refer to Figure 2- 3. At X2 on curve B , the
A) maximum occurs at Y1.
B) slope of the curve is zero.
C) slope is decreasing.
D) slope is increasing.
E) minimum occurs at Y4.
Correct Answer:

Verified
Correct Answer:
Verified
Related Questions
Q18: An economic model that contains a highly
Q28: Suppose an economist tells you that the
Q30: Suppose point A represents co- ordinates (X=10,
Q37: Which of the following statements belongs more
Q38: <img src="https://d2lvgg3v3hfg70.cloudfront.net/TB5438/.jpg" alt=" FIGURE 2- 3
Q41: The table below shows hypothetical per-
Q42: The slope of a straight line is
Q60: An economist has data showing Canadian GDP
Q67: A scatter diagram<br>A)plots a series of observations,
Q87: Each of the following is an example