Multiple Choice
The diagram below shows two production possibilities boundaries for Country X. 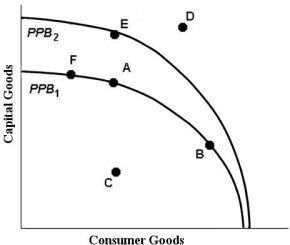 FIGURE 1- 3
-Refer to Figure 1- 3. If Country X were producing at point C,
A) it is not possible to move to any point on PPB1 or PPB2 without technological progress.
B) this is the maximum output possible from given resources.
C) the opportunity cost of moving to point A is to give up some capital goods.
D) the opportunity cost of moving to point B is to give up some consumption goods.
E) the opportunity cost of moving to point A is zero.
Correct Answer:

Verified
Correct Answer:
Verified
Q4: Economists usually assume that households and firms,
Q11: On a diagram of a production possibilities
Q15: Income redistribution in a mixed economy<br>A)risks reducing
Q25: A move from inside the production possibilities
Q26: The diagram below shows two production possibilities
Q29: The diagram below shows two production possibilities
Q38: Consider a production possibilities boundary showing the
Q57: Karl Marx argued that<br>A)centrally planned economies could
Q59: A barter system of exchange<br>A)requires the use
Q65: One of the "real" flows in the