Multiple Choice
The diagram below shows two production possibilities boundaries for Country X. 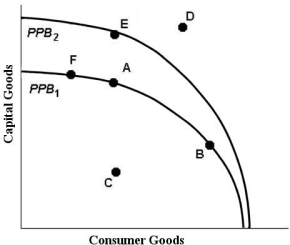 FIGURE 1- 3
-Refer to Figure 1- 3. A shift of the production possibilities boundary from PPB1 to PPB2 implies
A) that if point E is the new choice of outputs, productivity has increased in the consumption goods industry.
B) a movement from full employment to some unemployment.
C) that technology in the capital goods industries has improved.
D) that technology in the consumption goods industry has improved.
E) an inevitable decrease in total output.
Correct Answer:

Verified
Correct Answer:
Verified
Q11: On a diagram of a production possibilities
Q18: The Canadian economy is best described as<br>A)primarily
Q22: The table below illustrates that, in
Q25: A move from inside the production possibilities
Q29: The diagram below shows two production possibilities
Q30: The diagram below shows two production possibilities
Q38: Consider a production possibilities boundary showing the
Q59: A barter system of exchange<br>A)requires the use
Q72: Consider the following list: a worker with
Q74: Money facilitates trade and specialization by<br>A)increasing the