Solved

Table 96
Nuts-And-Bolts Inc -The Operations Manager Has Narrowed Down the Search for a for a Plant

Question 204

Multiple Choice

Table 9.6
Nuts-and-Bolts Inc. wishes to find the best location for a plant
that will satisfy customer demand in the following five areas.
 Area  Coordinates  Demand A(7,3) 30 B(7,7) 40C(1,10) 45D(2,6) 15E(4,5) 25\begin{array} { | c | c | c | } \hline \text { Area } & \text { Coordinates } & \text { Demand } \\\hline \mathrm { A } & ( 7,3 ) & 30 \\\mathrm {~B} & ( 7,7 ) & 40 \\\mathrm { C } & ( 1,10 ) & 45 \\\mathrm { D } & ( 2,6 ) & 15 \\\mathrm { E } & ( 4,5 ) & 25 \\\hline\end{array}
-The operations manager has narrowed down the search for a new plant to three locations.Fixed and variable costs follow:
 Location  Fixed Cost  per Year  Variable Cost  per Unit A$75,000$31 B250,00012C300,00015\begin{array} { | c | c | c | } \hline \text { Location } & \begin{array} { c } \text { Fixed Cost } \\\text { per Year }\end{array} & \begin{array} { c } \text { Variable Cost } \\\text { per Unit }\end{array} \\\hline \mathrm { A } & \$ 75,000 & \$ 31 \\\mathrm {~B} & 250,000 & 12 \\\mathrm { C } & 300,000 & 15 \\\hline\end{array}
Plot the total cost curves in the chart provided below,and identify the range over which each location would be best.Then use break-even analysis to calculate exactly the break-even quantity that defines each range.
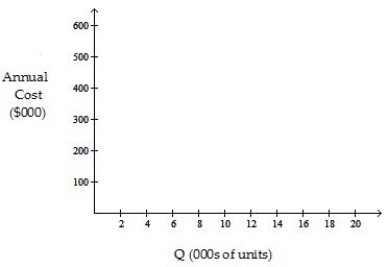
 Table 9.6 Nuts-and-Bolts Inc. wishes to find the best location for a plant that will satisfy customer demand in the following five areas.   \begin{array} { | c | c | c | }  \hline \text { Area } & \text { Coordinates } & \text { Demand } \\ \hline \mathrm { A } & ( 7,3 )  & 30 \\ \mathrm {~B} & ( 7,7 )  & 40 \\ \mathrm { C } & ( 1,10 )  & 45 \\ \mathrm { D } & ( 2,6 )  & 15 \\ \mathrm { E } & ( 4,5 )  & 25 \\ \hline \end{array}  -The operations manager has narrowed down the search for a new plant to three locations.Fixed and variable costs follow:  \begin{array} { | c | c | c | }  \hline \text { Location } & \begin{array} { c }  \text { Fixed Cost } \\ \text { per Year } \end{array} & \begin{array} { c }  \text { Variable Cost } \\ \text { per Unit } \end{array} \\ \hline \mathrm { A } & \$ 75,000 & \$ 31 \\ \mathrm {~B} & 250,000 & 12 \\ \mathrm { C } & 300,000 & 15 \\ \hline \end{array}  Plot the total cost curves in the chart provided below,and identify the range over which each location would be best.Then use break-even analysis to calculate exactly the break-even quantity that defines each range.   Which of the following statements is correct? A)  Location C is the best one if volumes are quite low. B)  The break-even quantity between B and C is less than or equal to 6000 units. C)  The break-even quantity between A and B is less than or equal to 9170 units. D)  The break-even quantity between A and B is more than 9170 units but less than 9270 units.
Which of the following statements is correct?


A) Location C is the best one if volumes are quite low.
B) The break-even quantity between B and C is less than or equal to 6000 units.
C) The break-even quantity between A and B is less than or equal to 9170 units.
D) The break-even quantity between A and B is more than 9170 units but less than 9270 units.

Correct Answer:

verifed

Verified

Unlock this answer now
Get Access to more Verified Answers free of charge

Related Questions