Multiple Choice
The graph in Figure 3-34 illustrates the change in the rate of an enzyme-catalyzed reaction as the concentration of substrate is increased.Which of the values listed below is used to calculate the enzyme turnover number? 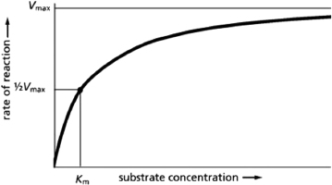 Figure 3-34
A) ½Vmax
B) Km
C) Vmax
D) Vmax − Km
Correct Answer:

Verified
Correct Answer:
Verified
Related Questions
Q13: Which of the following statements is FALSE
Q14: Oxidation is the process by which oxygen
Q15: The equilibrium constant for complex formation between
Q16: For each of the pairs A-D
Q17: In general, there is a positive change
Q19: The anhydride formed between a carboxylic acid
Q20: Your body extracts energy from the food
Q21: In the case of a simple conversion
Q22: You are studying a biochemical pathway
Q23: At first glance, it may seem that