Multiple Choice
Figure 10-9
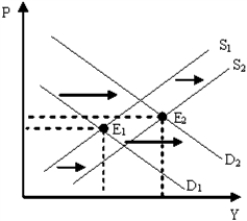
-Figure 10-9 illustrates a period of
A) economic growth and high inflation.
B) economic growth and low inflation.
C) economic recession and high inflation.
D) economic recession and low inflation.
Correct Answer:

Verified
Correct Answer:
Verified
Q25: Suppose we observe an economy experience an
Q26: When economists refer to the economy's self-correcting
Q27: Equilibrium GDP in excess of potential GDP
Q28: Figure 10-7<br> <img src="https://d2lvgg3v3hfg70.cloudfront.net/TB8592/.jpg" alt="Figure 10-7
Q29: When the price level is considered, the
Q31: When the inflationary gap is finally eliminated,
Q32: Improvements in productivity shift the aggregate supply
Q33: Recessionary gap is the amount by which
Q34: Aggregate supply is defined as<br>A)how much the
Q35: The aggregate supply curve is<br>A)generally flatter as