Multiple Choice
A CFO is looking at what percentage of a company's resources are spent on computing. He samples companies in the pharmaceutical industry and develops the following stem-and-leaf display (leaf unit = 0.1) . 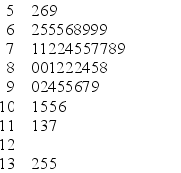 If you were creating a frequency histogram using these data, how many classes would you create?
A) 4
B) 5
C) 6
D) 7
E) 8
Correct Answer:

Verified
Correct Answer:
Verified
Q85: A(n) _ is a graphical presentation of
Q86: An unusually large or small observation separated
Q87: The number of weekly sales calls by
Q88: When establishing the classes for a frequency
Q89: A company collected the ages from a
Q91: A runs plot is a form of
Q92: A treemap displays information as a series
Q93: A bullet graph features a single measure
Q94: Sparklines are line charts and are often
Q95: A CFO is looking at what percentage