Multiple Choice
A CFO is looking at what percentage of a company's resources are spent on computing. He samples companies in the pharmaceutical industry and develops the following stem-and-leaf display (leaf unit = 0.1) . 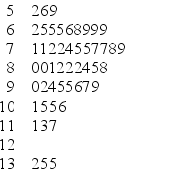 What would be the first class interval for the frequency histogram?
A) 5.2 < 6.6
B) 5.2 < 6.0
C) 5.0 < 6.0
D) 5.0 < 6.4
E) 5.2 < 6.4
Correct Answer:

Verified
Correct Answer:
Verified
Q90: A CFO is looking at what percentage
Q91: A runs plot is a form of
Q92: A treemap displays information as a series
Q93: A bullet graph features a single measure
Q94: Sparklines are line charts and are often
Q96: Recently an advertising company called 200 people
Q97: It is possible to create different interpretations
Q98: The number of weekly sales calls by
Q99: A CFO is looking at what percentage
Q100: The following is a relative frequency distribution