Multiple Choice
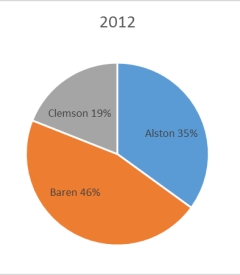
The 2010 and 2012 market share data of three competitors (Alston, Baren, and Clemson) in an oligopolistic industry are presented in the following pie charts.Total sales for this industry were $1.5 billion in 2010 and $1.8 billion in 2012.Clemson's sales in 2010 were ___________. 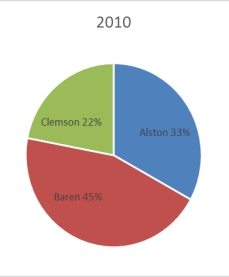
A) $330 million
B) $630 million
C) $675 million
D) $828 million
E) $928 million
Correct Answer:

Verified
Correct Answer:
Verified
Q5: The following time-series data shows the
Q6: The following class intervals for a
Q7: The number of phone calls arriving
Q8: Monthly sales were tracked and shown on
Q9: The difference between the highest number and
Q11: Each day, the office staff at Oasis
Q12: The staff of Ms.Tamara Hill, VP of
Q13: The customer help center in your company
Q14: The number of phone calls arriving
Q15: The following time-series data shows the