Multiple Choice
Monthly sales were tracked and shown on the graph below. 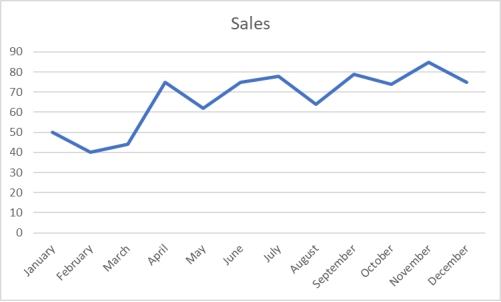 Based on this graph, which month had the highest sales?
A) April
B) July
C) February
D) November
E) December
Correct Answer:

Verified
Correct Answer:
Verified
Related Questions
Q3: The cumulative frequency for a class is
Q4: According to the following graphic, "Bent Pins"
Q5: The following time-series data shows the
Q6: The following class intervals for a
Q7: The number of phone calls arriving
Q9: The difference between the highest number and
Q10: The 2010 and 2012 market share data
Q11: Each day, the office staff at Oasis
Q12: The staff of Ms.Tamara Hill, VP of
Q13: The customer help center in your company