Multiple Choice
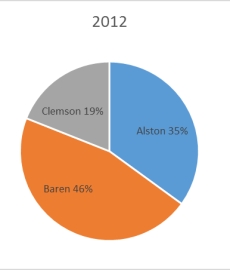
The 2010 and 2012 market share data of three competitors (Alston, Baren, and Clemson) in an oligopolistic industry are presented in the following pie charts.Total sales for this industry were $1.5 billion in 2010 and $1.8 billion in 2012.Baren's sales in 2010 were ___________. 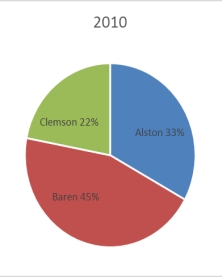
A) $342 million
B) $630 million
C) $675 million
D) $828 million
E) $928 million
Correct Answer:

Verified
Correct Answer:
Verified
Q68: Each day, the office staff at Oasis
Q69: A scatter plot shows how the numbers
Q70: Consider the following stem and leaf
Q71: A cumulative frequency distribution provides a running
Q72: A scatter plot is useful for examining
Q74: The staff of Ms.Tamara Hill, VP of
Q75: Consider the following frequency distribution:
Q76: A shirt production company has tracked their
Q77: Your company is doing market research to
Q78: A person has decided to construct a