Multiple Choice
A shirt production company has tracked their sales of red and blue shirts over the past few years.The graph of both is shown below. 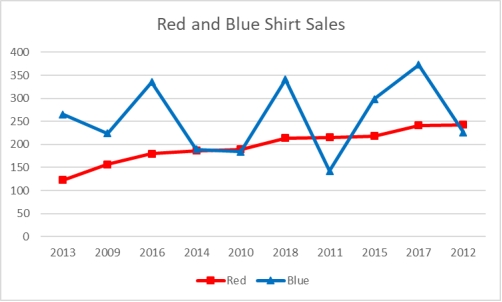 What trends can be identified from this graph?
A) Sales of red shirts have consistently increased throughout this time.
B) Sales of blue shirts are currently declining.
C) Between 2010 and 2018, sales of blue shirts consistently increased.
D) Cannot determine trends as data not in chronological order.
E) The smallest annual increase in red shirt sales was between the years of 2010 and 2014.
Correct Answer:

Verified
Correct Answer:
Verified
Q71: A cumulative frequency distribution provides a running
Q72: A scatter plot is useful for examining
Q73: The 2010 and 2012 market share data
Q74: The staff of Ms.Tamara Hill, VP of
Q75: Consider the following frequency distribution:
Q77: Your company is doing market research to
Q78: A person has decided to construct a
Q79: Pinky Bauer, Chief Financial Officer of
Q80: Consider the following stem and leaf
Q81: If both variables being analyzed are nominal