Multiple Choice
A shirt production company has tracked their production since the company started in 1999.The graph of their annual production is shown. 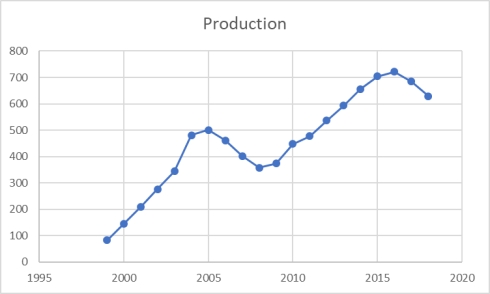 During these years, production has generally _______________.
A) increased in these years.
B) declined in most of the years shown.
C) increased in every year since 1999.
D) decreased in most of those years.
E) increased and declined without a discernable trend.
Correct Answer:

Verified
Correct Answer:
Verified
Q78: A person has decided to construct a
Q79: Pinky Bauer, Chief Financial Officer of
Q80: Consider the following stem and leaf
Q81: If both variables being analyzed are nominal
Q82: Sales are tracked during the past year
Q84: When looking at a scatter plot, if
Q85: To show hourly sales throughout a day,
Q86: A scatter plot indicates that two variables
Q87: Consider the following frequency distribution:
Q88: A summary of data in which raw