Multiple Choice
Sales are tracked during the past year in the graph below. 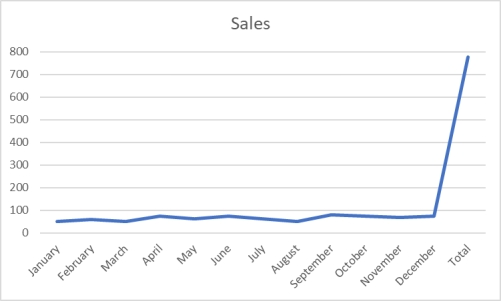 What would be the most effective strategy to allow management to more clearly discern monthly trends in sales?
A) Remove the total value from being included in the graph.
B) Have the axis on the left show more detailed grid lines between 0 and 100
C) Show the trend line in a more vivid color.
D) Add labels to each of the graphed data points.
E) Add minor grid lines throughout the graph making values more clear.
Correct Answer:

Verified
Correct Answer:
Verified
Q77: Your company is doing market research to
Q78: A person has decided to construct a
Q79: Pinky Bauer, Chief Financial Officer of
Q80: Consider the following stem and leaf
Q81: If both variables being analyzed are nominal
Q83: A shirt production company has tracked their
Q84: When looking at a scatter plot, if
Q85: To show hourly sales throughout a day,
Q86: A scatter plot indicates that two variables
Q87: Consider the following frequency distribution: