Multiple Choice
A shirt production company has tracked their production and expenses since the company started in 1999.The graph of both is shown. 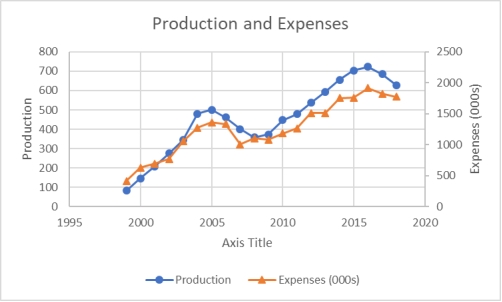 When comparing production and expenses during these years, what conclusion is not true?
A) Both series are generally decreasing.
B) Both series are generally increasing.
C) The time from 2005 to 2008 indicates a downward trend for both
D) The time from 2008 to 2018 indicates an upward trend for both
E) Expenses and production appear to follow similar trends
Correct Answer:

Verified
Correct Answer:
Verified
Q12: The staff of Ms.Tamara Hill, VP of
Q13: The customer help center in your company
Q14: The number of phone calls arriving
Q15: The following time-series data shows the
Q16: To show differences between different series during
Q18: To consider historical data as part of
Q19: A histogram can be described as a
Q20: Monthly sales were tracked and shown on
Q21: The staff of Mr.Wayne Wertz, VP of
Q22: The class mark is the _, and