Multiple Choice
Monthly sales were tracked and shown on the graph below. 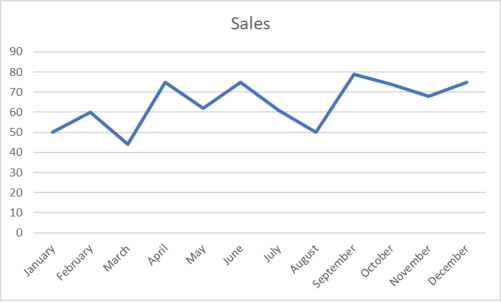 Which of the following would be an incorrect conclusion based on this graph?
A) Sales were lowest in the month of March.
B) Sales increased between August and September.
C) The last month had higher sales than the first month.
D) Sales declined from June through August.
E) The last month had higher sales than September.
Correct Answer:

Verified
Correct Answer:
Verified
Q15: The following time-series data shows the
Q16: To show differences between different series during
Q17: A shirt production company has tracked their
Q18: To consider historical data as part of
Q19: A histogram can be described as a
Q21: The staff of Mr.Wayne Wertz, VP of
Q22: The class mark is the _, and
Q23: The following class intervals for a
Q24: In a frequency distribution, the first class
Q25: A retail shoe company would like to