Multiple Choice
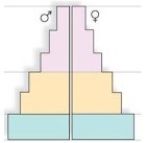
In a population with low death rates,this age structure diagram indicates that 
A) the population is decreasing.
B) the population is stable.
C) the biotic potential must be larger than usual.
D) the population will continue to grow for some time.
Correct Answer:

Verified
Correct Answer:
Verified
Q34: Opportunistic species<br>A)are composed of large individual organisms.<br>B)are
Q35: Which of these diagrams represents an age
Q36: An ecologist may study<br>A)the human impact on
Q37: Which of the following studies would lie
Q38: Survivorship may be defined as the probability
Q40: When the number of births plus immigration
Q41: Which variable is not a density-dependent factor?<br>A)competition
Q42: Dandelions and tent caterpillars,which are r-strategists,are examples
Q43: A pond represents a(n)_,while the minnows represent
Q44: Consider that a species of salmon lays