Multiple Choice
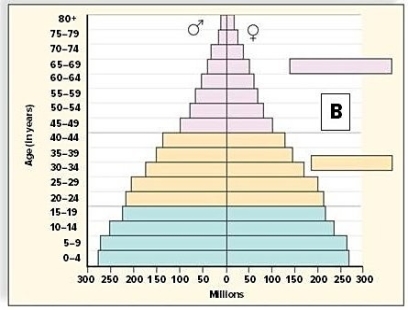
Which of these diagrams represents an age structure diagram of more-developed countries? 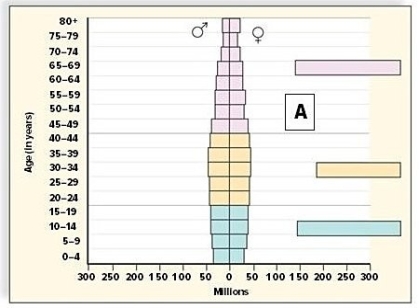
A) Diagram A
B) Diagram B
Correct Answer:

Verified
Correct Answer:
Verified
Related Questions
Q30: Parasitism,competition,and predation are density-independent factors that help
Q31: All of the following factors will keep
Q32: Bangladesh has 2,596 persons per square mile,while
Q33: Zero population growth will be achieved as
Q34: Opportunistic species<br>A)are composed of large individual organisms.<br>B)are
Q36: An ecologist may study<br>A)the human impact on
Q37: Which of the following studies would lie
Q38: Survivorship may be defined as the probability
Q39: In a population with low death rates,this
Q40: When the number of births plus immigration