Multiple Choice
Refer to the information provided in Figure 5.3 below to answer the question(s) that follow. 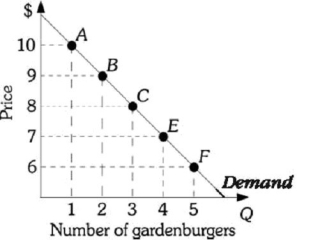 Figure 5.3
-Refer to Figure 5.3. Using the midpoint formula, if the price of a gardenburger increases from $7 to $9, the price elasticity of demand equals ________ and the increase results in a(n) ________ in total revenue.
A) -0.375; increase
B) -0.5; decrease
C) -2.67; decrease
D) -8; decrease
Correct Answer:

Verified
Correct Answer:
Verified
Q15: Refer to the information provided in Figure
Q16: Refer to the information provided in Figure
Q17: A demand curve with continuously changing slope
Q18: When the price of oysters decreases 25%,
Q19: Refer to the information provided in Figure
Q21: Related to the Economics in Practice on
Q22: A positive cross-price elasticity between two goods
Q23: The income elasticity of demand<br>A) measures the
Q24: If the quantity of peanut butter demanded
Q25: Slope is the best measure of responsiveness