Multiple Choice
Refer to the information provided in Figure 5.7 below to answer the question(s) that follow. 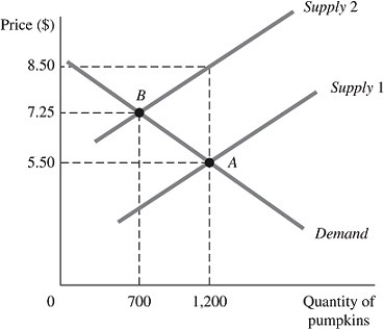 Figure 5.7
The above figure represents the market for pumpkins both before and after the imposition of an excise tax, which is represented by the shift of the supply curve.
-Refer to Figure 5.7. Using the midpoint formula, the price elasticity of demand for pumpkins from the equilibrium point before the imposition of the tax to the equilibrium point after the imposition of the tax is
A) -0.02.
B) -0.47.
C) -2.11
D) -4.43
Correct Answer:

Verified
Correct Answer:
Verified
Q14: Every point on a linear demand curve
Q15: Refer to the information provided in Figure
Q16: Refer to the information provided in Figure
Q17: A demand curve with continuously changing slope
Q18: When the price of oysters decreases 25%,
Q20: Refer to the information provided in Figure
Q21: Related to the Economics in Practice on
Q22: A positive cross-price elasticity between two goods
Q23: The income elasticity of demand<br>A) measures the
Q24: If the quantity of peanut butter demanded