Multiple Choice
Refer to the graph shown. Between points B and D, marginal utility is: 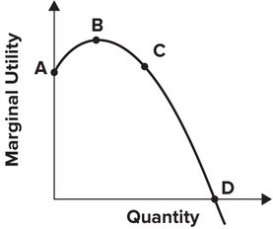
A) increasing, and so total utility is falling.
B) positive, and so total utility is increasing.
C) positive, and so total utility is falling.
D) increasing, and so total utility is at its maximum.
Correct Answer:

Verified
Correct Answer:
Verified
Q84: Suppose Jack purchases four rolls of brown
Q85: Conspicuous consumption refers to the consumption of
Q86: When marginal utility of consuming a good
Q87: As long as total utility is increasing,
Q88: When the ratios of the marginal utility
Q90: The use of expensive cars and yachts
Q91: Joe is maximizing utility by consuming three
Q92: The last Big Mac that Eva consumes
Q93: Refer to the graph shown. Between points
Q94: The principle of diminishing marginal utility states