Multiple Choice
Refer to the graph shown. Given the long-run average cost curve, the minimum efficient scale of production is: 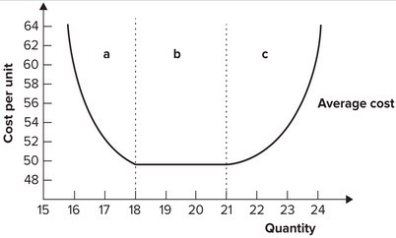
A) 16.
B) 18 to 21.
C) 21.
D) 23.
Correct Answer:

Verified
Correct Answer:
Verified
Related Questions
Q53: Generally, as the size of a firm
Q54: At one time sea lions were depleting
Q55: Constant returns to scale are associated with
Q56: Economic efficiency is achieved at a particular
Q57: Because there are very significant economies of
Q59: The long-run average cost curve is tangent
Q60: Which of the following is most likely
Q61: A firm finds that producing 30,000 vases
Q62: Refer to the graph shown. The marginal
Q63: Refer to the graph shown. The output