Multiple Choice
Refer to the graph shown. The output range in region a is associated with: 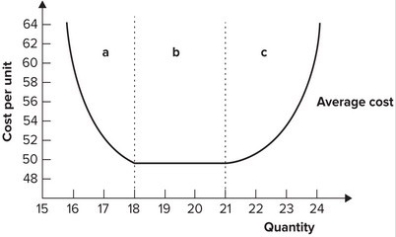
A) increasing marginal productivity.
B) constant returns to scale.
C) economies of scale.
D) diseconomies of scale.
Correct Answer:

Verified
Correct Answer:
Verified
Related Questions
Q58: Refer to the graph shown. Given the
Q59: The long-run average cost curve is tangent
Q60: Which of the following is most likely
Q61: A firm finds that producing 30,000 vases
Q62: Refer to the graph shown. The marginal
Q64: The production techniques available to real-world firms
Q65: Refer to the graph shown. A firm
Q66: Refer to the graph shown. A firm
Q67: Refer to the graph shown. If the
Q68: The relationship between long-run and short-run average