Multiple Choice
Refer to the graph shown. The output range in region c is associated with: 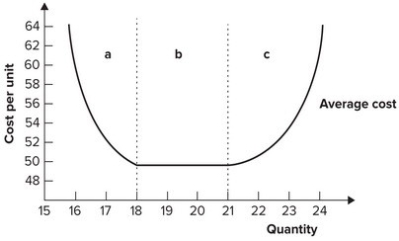
A) diminishing marginal productivity.
B) constant returns to scale.
C) economies of scale.
D) diseconomies of scale.
Correct Answer:

Verified
Correct Answer:
Verified
Related Questions
Q108: At the planned output level, short-run average
Q109: A firm can use 5 workers and
Q110: An entrepreneur most likely would develop a
Q111: Refer to the graph shown. If a
Q112: Refer to the graph shown. The cheapest
Q114: Refer to the graph shown. The graph
Q115: A firm's average cost increases as it
Q116: When per-unit costs increase as output increases,
Q117: Globalization has made economies of scope:<br>A) more
Q118: Economies of scale do not exist in