Multiple Choice
Refer to the graph shown. If a firm wants to produce 300 units of output, it should use the plant size represented by: 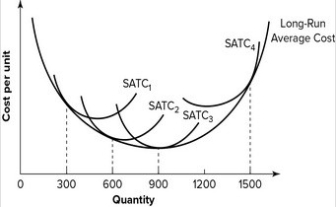
A) SATC1.
B) SATC2.
C) SATC3.
D) SATC4.
Correct Answer:

Verified
Correct Answer:
Verified
Related Questions
Q106: Refer to the graph shown. If the
Q107: Suppose the average total cost of producing
Q108: At the planned output level, short-run average
Q109: A firm can use 5 workers and
Q110: An entrepreneur most likely would develop a
Q112: Refer to the graph shown. The cheapest
Q113: Refer to the graph shown. The output
Q114: Refer to the graph shown. The graph
Q115: A firm's average cost increases as it
Q116: When per-unit costs increase as output increases,