Multiple Choice
Refer to the graph shown. If the firm wants to produce 900 units of output, it should use the plant size represented by: 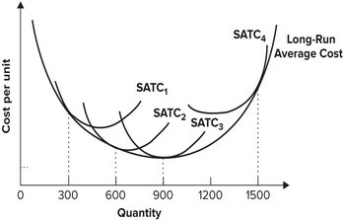
A) SATC1.
B) SATC2.
C) SATC3.
D) SATC4.
Correct Answer:

Verified
Correct Answer:
Verified
Related Questions
Q101: The reason for the merger of two
Q102: Refer to the graph shown. The cost
Q103: An isocost line is a line that
Q104: When the number of mega-producers of hobs
Q105: ABC Co. produces only gadgets, and XYZ
Q107: Suppose the average total cost of producing
Q108: At the planned output level, short-run average
Q109: A firm can use 5 workers and
Q110: An entrepreneur most likely would develop a
Q111: Refer to the graph shown. If a