Multiple Choice
Refer to the graph shown. The shift from SATC3 to SATC4 reflects: 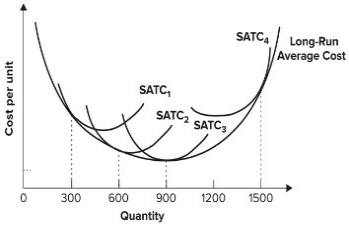
A) economies of scale.
B) diseconomies of scale.
C) diminishing marginal productivity.
D) increasing marginal productivity.
Correct Answer:

Verified
Correct Answer:
Verified
Related Questions
Q1: Which of the following is an accurate
Q2: "For-benefit" corporations are created to pursue multiple
Q4: If a machine cost $50,000 initially and
Q5: The long-run average cost curve is horizontal
Q6: Which of the following statements is true?<br>A)
Q7: Refer to the graph shown. A firm
Q8: The economically efficient method of production:<br>A) is
Q9: The long-run average cost of producing 12
Q10: Which of the following provides the best
Q11: To manufacture 1,000 pairs of shoes in