Multiple Choice
Refer to the graph shown. A firm can produce the same amount of output at points: 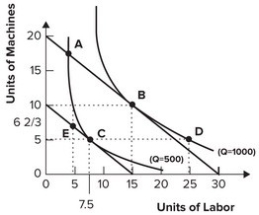
A) A and B.
B) E and C.
C) B and C.
D) A and C.
Correct Answer:

Verified
Correct Answer:
Verified
Related Questions
Q2: "For-benefit" corporations are created to pursue multiple
Q3: Refer to the graph shown. The shift
Q4: If a machine cost $50,000 initially and
Q5: The long-run average cost curve is horizontal
Q6: Which of the following statements is true?<br>A)
Q8: The economically efficient method of production:<br>A) is
Q9: The long-run average cost of producing 12
Q10: Which of the following provides the best
Q11: To manufacture 1,000 pairs of shoes in
Q12: An isoquant is a curve that represents