Multiple Choice
The following graph shows average fixed costs, average variable costs, average total costs, and marginal costs of production. 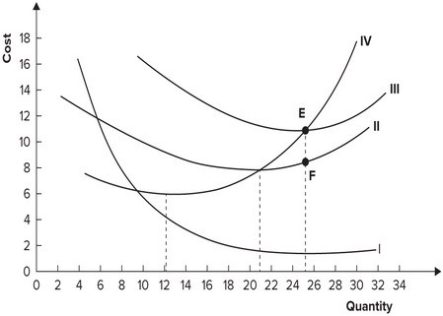 Average variable cost is minimized when output equals:
A) 12 units.
B) 6 units.
C) 21 units.
D) 25 units.
Correct Answer:

Verified
Correct Answer:
Verified
Related Questions
Q4: Refer to the graph shown. Within which
Q5: Refer to the table shown. The
Q6: What kind of costs remain the same
Q7: Refer to the table shown. The
Q8: The vertical distance between the average total
Q10: Average variable cost is total variable cost:<br>A)
Q11: If the law of diminishing marginal productivity
Q12: When output is 500, a firm's fixed
Q13: The law of diminishing marginal productivity states
Q14: The total fixed cost curve is:<br>A) upward