Multiple Choice
Refer to the graph shown. Within which part of the production function is the firm most likely to operate? 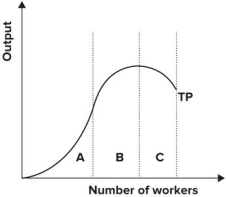
A) A
B) B
C) C
D) B and C
Correct Answer:

Verified
Correct Answer:
Verified
Related Questions
Q1: When output is 20, fixed costs are
Q2: Refer to the following graph. <img src="https://d2lvgg3v3hfg70.cloudfront.net/TB7145/.jpg"
Q3: Refer to the graph shown. <img src="https://d2lvgg3v3hfg70.cloudfront.net/TB7145/.jpg"
Q5: Refer to the table shown. The
Q6: What kind of costs remain the same
Q7: Refer to the table shown. The
Q8: The vertical distance between the average total
Q9: The following graph shows average fixed costs,
Q10: Average variable cost is total variable cost:<br>A)
Q11: If the law of diminishing marginal productivity