Multiple Choice
The following graph shows average fixed costs, average variable costs, average total costs, and marginal costs of production. 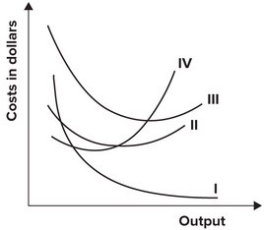 The average total cost curve is represented by which curve?
A) I
B) II
C) III
D) IV
Correct Answer:

Verified
Correct Answer:
Verified
Related Questions
Q17: Total output per worker is also called:<br>A)
Q18: The following graph shows average fixed costs,
Q19: The relationship between the quantity of inputs
Q20: Refer to the table shown. If
Q21: Refer to the table shown. At
Q23: Accounting profit and economic profit differ because
Q24: Suppose you operate a factory that produces
Q25: The U shape of the average total
Q26: Refer to the table shown. The
Q27: Refer to the following graph. <img src="https://d2lvgg3v3hfg70.cloudfront.net/TB7145/.jpg"