Multiple Choice
The following graph shows average fixed costs, average variable costs, average total costs, and marginal costs of production. 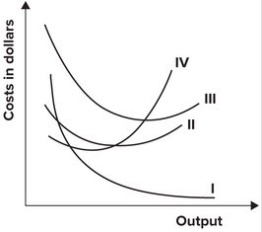 In the graph shown, the marginal cost curve is represented by which curve?
A) I
B) II
C) III
D) IV
Correct Answer:

Verified
Correct Answer:
Verified
Related Questions
Q13: The law of diminishing marginal productivity states
Q14: The total fixed cost curve is:<br>A) upward
Q15: If your latest test grade and your
Q16: If a firm shuts down for a
Q17: Total output per worker is also called:<br>A)
Q19: The relationship between the quantity of inputs
Q20: Refer to the table shown. If
Q21: Refer to the table shown. At
Q22: The following graph shows average fixed costs,
Q23: Accounting profit and economic profit differ because