Multiple Choice
The following graph shows average fixed costs, average variable costs, average total costs, and marginal costs of production. 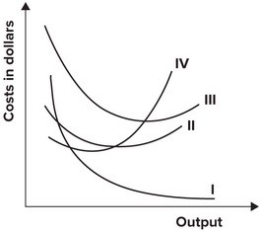 The average variable cost curve is represented by which curve?
A) I
B) II
C) III
D) IV
Correct Answer:

Verified
Correct Answer:
Verified
Related Questions
Q66: The minimum point of the average total
Q67: Refer to the table shown. Marginal
Q68: Average fixed cost:<br>A) remains constant and doesn't
Q69: Refer to the following graph. <img src="https://d2lvgg3v3hfg70.cloudfront.net/TB7145/.jpg"
Q70: Refer to the graph shown. The line
Q72: Rachel left her job as a graphic
Q73: As output increases, average total cost always
Q74: When the average variable cost curve is
Q75: The only variable input used in producing
Q76: If marginal cost is greater than average