Multiple Choice
Refer to the graph shown. The line segment that represents average total costs of producing Q* is: 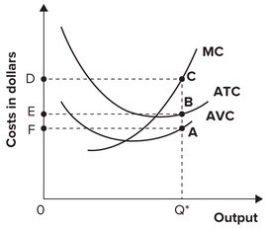
A) AQ*.
B) BQ*.
C) CQ*.
D) AB.
Correct Answer:

Verified
Correct Answer:
Verified
Related Questions
Q65: The following graph shows average fixed costs,
Q66: The minimum point of the average total
Q67: Refer to the table shown. Marginal
Q68: Average fixed cost:<br>A) remains constant and doesn't
Q69: Refer to the following graph. <img src="https://d2lvgg3v3hfg70.cloudfront.net/TB7145/.jpg"
Q71: The following graph shows average fixed costs,
Q72: Rachel left her job as a graphic
Q73: As output increases, average total cost always
Q74: When the average variable cost curve is
Q75: The only variable input used in producing