Multiple Choice
Refer to the graph shown. When price rises from $30 to $40: 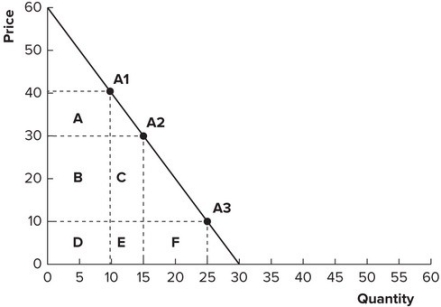
A) lost revenue is represented by areas C and E and gained revenue is represented by area A.
B) gained revenue is represented by areas C and E and lost revenue is represented by area A.
C) lost revenue is represented by areas B, C, D, and E and gained revenue is represented by area A.
D) gained revenue is represented by areas B, C, D, and E and lost revenue is represented by area A.
Correct Answer:

Verified
Correct Answer:
Verified
Q60: Elasticity of demand for bus services is
Q61: It is estimated that a 3 percent
Q62: The demand for a good is elastic.
Q63: If demand is highly inelastic and supply
Q64: Along a straight-line demand curve, elasticity:<br>A) rises
Q66: Compute the approximate elasticity of supply from
Q67: If pizzas and quesadillas are substitutes and
Q68: If demand is highly inelastic and supply
Q69: Refer to the graph shown. Between points
Q70: Income elasticity is defined as the:<br>A) change