Multiple Choice
Refer to the graph shown. Between points E and F demand is: 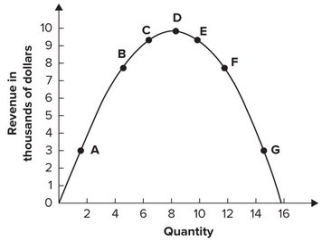
A) inelastic.
B) elastic.
C) unit elastic.
D) perfectly elastic.
Correct Answer:

Verified
Correct Answer:
Verified
Related Questions
Q64: Along a straight-line demand curve, elasticity:<br>A) rises
Q65: Refer to the graph shown. When price
Q66: Compute the approximate elasticity of supply from
Q67: If pizzas and quesadillas are substitutes and
Q68: If demand is highly inelastic and supply
Q70: Income elasticity is defined as the:<br>A) change
Q71: For substitutes:<br>A) cross-price elasticity of demand can
Q72: Refer to the following graph. <img src="https://d2lvgg3v3hfg70.cloudfront.net/TB7145/.jpg"
Q73: Which of the following statements is true
Q74: A newspaper recently lowered its price from