Multiple Choice
Refer to the graph shown. When price rises from $10 to $30: 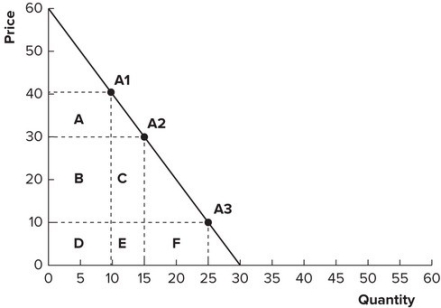
A) lost revenue is represented by areas B and C and gained revenue is represented by area F.
B) gained revenue is represented by areas B and C and lost revenue is represented by area F.
C) lost revenue is represented by areas B, C, and D and gained revenue is represented by area A.
D) gained revenue is represented by areas B, C, and D and lost revenue is represented by area A.
Correct Answer:

Verified
Correct Answer:
Verified
Q164: Refer to the graph shown. The approximate
Q165: Refer to the graph shown. When price
Q166: When the price of a good increases,
Q167: Refer to the graph shown. The approximate
Q168: It is estimated that a 10 percent
Q170: GreenTree Corporation sells live Christmas trees. It
Q171: Refer to the graph shown. When price
Q172: If the quantity of picture frames supplied
Q173: Refer to the graph shown. At which
Q174: If the quantity of Big Macs demanded