Multiple Choice
Refer to the graph shown. When price increases from $4 to $6, total revenue: 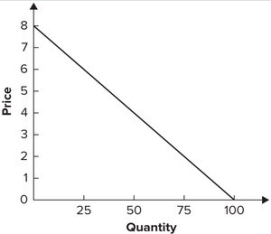
A) increases from $200 to $250.
B) increases from $150 to $200.
C) decreases from $200 to $150.
D) decreases from $250 to $200.
Correct Answer:

Verified
Correct Answer:
Verified
Related Questions
Q166: When the price of a good increases,
Q167: Refer to the graph shown. The approximate
Q168: It is estimated that a 10 percent
Q169: Refer to the graph shown. When price
Q170: GreenTree Corporation sells live Christmas trees. It
Q172: If the quantity of picture frames supplied
Q173: Refer to the graph shown. At which
Q174: If the quantity of Big Macs demanded
Q175: Refer to the graph shown. For which
Q176: Refer to the graph shown. When price