Multiple Choice
Refer to the following graphs. 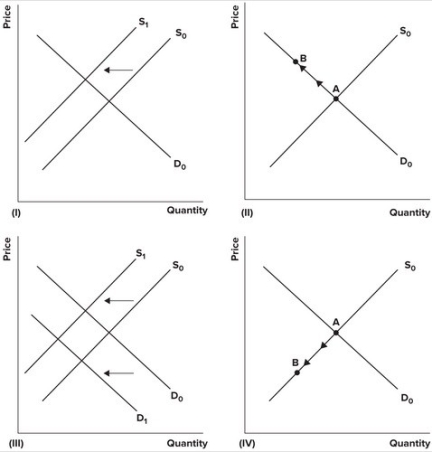 A recent report indicated that 50 intensive-care unit patients die for every 1,000 who are managed with a heart device known as the right heart catheter. Suppose as a result, the FDA limited supply of the heart catheters. The effect of the report and subsequent action by the FDA on the market for right heart catheters is best shown by which of the graphs?
A) I
B) II
C) III
D) IV
Correct Answer:

Verified
Correct Answer:
Verified
Q126: An increase in quantity and an indeterminate
Q127: Consider a market for fish whose market
Q128: Refer to the table shown that
Q129: In a third-party payer system:<br>A) total expenditures
Q130: Refer to the following graph. <img src="https://d2lvgg3v3hfg70.cloudfront.net/TB7145/.jpg"
Q131: Refer to the graph shown. Which of
Q132: Suppose that the free market labor supply
Q133: Which price ceiling will cause the greatest
Q134: Suppose that initially, supply is given by
Q135: If the government imposes an excise tax