Multiple Choice
Refer to the graph shown that depicts a third-party payer market for prescription drugs. What is the cost of this program to the third-party if a $2 co-pay is established? 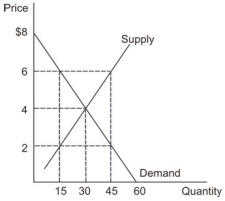
A) $270
B) $240
C) $180
D) $120
Correct Answer:

Verified
Correct Answer:
Verified
Q46: Suppose that initially, the equations for demand
Q47: Stricter environmental regulations and increased demand for
Q48: Given the equations for demand and supply:
Q49: When an effective price ceiling is removed,
Q50: Real-world experience shows that when weather conditions
Q52: Refer to the following graph. <img src="https://d2lvgg3v3hfg70.cloudfront.net/TB7145/.jpg"
Q53: When the polio vaccine first became available
Q54: Consider a market for fish whose market
Q55: Suppose that there is a renewed interest
Q56: Refer to the table shown that