Multiple Choice
Refer to the following graph. 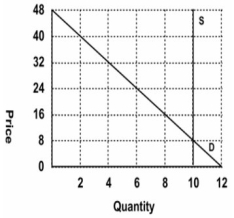 Which of the following pairs of equations describes the supply and demand curves?
A) Qs = 10; Qd = 12 − 0.25P, respectively
B) Qs = 10; Qd = 48 − 2P, respectively
C) Qs = P; Qd = 0.25P + 22, respectively
D) Cannot be determined
Correct Answer:

Verified
Correct Answer:
Verified
Q47: Stricter environmental regulations and increased demand for
Q48: Given the equations for demand and supply:
Q49: When an effective price ceiling is removed,
Q50: Real-world experience shows that when weather conditions
Q51: Refer to the graph shown that depicts
Q53: When the polio vaccine first became available
Q54: Consider a market for fish whose market
Q55: Suppose that there is a renewed interest
Q56: Refer to the table shown that
Q57: A tariff is:<br>A) a tax that government