Multiple Choice
Refer to the graph shown. In 1975 U.S. President Gerald Ford instituted a large tax cut. At the same time, the Fed expanded the money supply. The effect of these policies on the AD curve is best shown as a movement from: 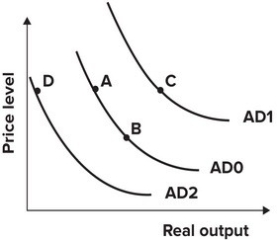
A) A to B.
B) D to A.
C) A to D.
D) B to A.
Correct Answer:

Verified
Correct Answer:
Verified
Q133: Which of the following do economists generally
Q134: Equilibrium income is that level of income:<br>A)which
Q135: The rapid development of Internet technologies during
Q136: Refer to the graph shown. A movement
Q137: Some economists believe that the good times
Q139: Demonstrate graphically and explain verbally the case
Q140: In which of the following situations is
Q141: In 1979, the Federal Reserve decided to
Q142: If the U.S. government increased taxes without
Q143: A change in which of the following