Multiple Choice
Refer to the graph shown. A movement from D to C is most likely to be caused by: 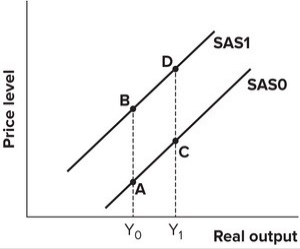
A) an increase in input prices.
B) a reduction in sales taxes.
C) an increase in aggregate demand.
D) an increase in import prices.
Correct Answer:

Verified
Correct Answer:
Verified
Related Questions
Q131: Refer to the graph shown. An expansionary
Q132: If the money wealth, interest rate, and
Q133: Which of the following do economists generally
Q134: Equilibrium income is that level of income:<br>A)which
Q135: The rapid development of Internet technologies during
Q137: Some economists believe that the good times
Q138: Refer to the graph shown. In 1975
Q139: Demonstrate graphically and explain verbally the case
Q140: In which of the following situations is
Q141: In 1979, the Federal Reserve decided to