Multiple Choice
Refer to the graph shown. 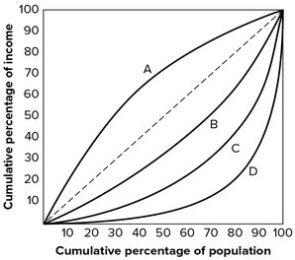 The Lorenz curve showing the most income inequality is
A) A.
B) B.
C) C.
D) D.
Correct Answer:

Verified
Correct Answer:
Verified
Related Questions
Q2: How has income distribution changed in the
Q9: Which program has been very successful in
Q12: A Lorenz curve is a geometric representation
Q12: What are the distributive consequences of the
Q47: Attempts to reduce income inequality may lead
Q88: The following diagram shows three Lorenz curves
Q88: Friedrich Nietzsche's views on income distribution and
Q89: Refer to the graph shown. <img src="https://d2lvgg3v3hfg70.cloudfront.net/TB7143/.jpg"
Q94: Use the table below to answer
Q96: Refer to the graph shown. <img src="https://d2lvgg3v3hfg70.cloudfront.net/TB7143/.jpg"