Multiple Choice
Refer to the graph shown. 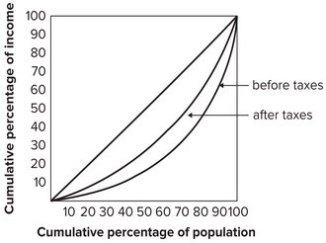 A possible explanation for the difference between the distribution of income before taxes and the distribution of income after taxes shown in the graph is that the tax system:
A) is regressive.
B) is proportional.
C) is progressive.
D) does not affect income inequality.
Correct Answer:

Verified
Correct Answer:
Verified
Q5: How does the Lorenz curve for the
Q9: Which program has been very successful in
Q12: What are the distributive consequences of the
Q12: A Lorenz curve is a geometric representation
Q15: What are the distributive consequences of each
Q51: Poverty is defined by the U.S. government
Q85: Refer to the graph shown. <img src="https://d2lvgg3v3hfg70.cloudfront.net/TB7143/.jpg"
Q88: The following diagram shows three Lorenz curves
Q93: Refer to the graph shown. <img src="https://d2lvgg3v3hfg70.cloudfront.net/TB7143/.jpg"
Q94: Use the table below to answer